Twitter Analysis for GLS09
Here is the latest in my continuing series on analyzing Twitter conference backchannels by their hashtags and replies/retweets. This one, though, is a bit different and special... because I was actually at the conference! Below is my breakdown of Games + Learning + Society 2009 via the #gls and #gls09 hashtags.
One of the reasons this conference is special to me is that I collaborated with Colleen Macklin, John Sharp, and Eric Zimmerman on a game called BACKCHATTER. BACKCHATTER used the tweets from the conference participants as a means to bet on what you thought would be the hot terms coming up in the next set of presentations and keynotes. It was a lot of fun, and a number of participants said some very nice things about the game:
- Betting on trends in the Twitter backchannel
- GLS Overview and Backchatter
- Backchatter - Trendwatching in Twitter
Alice Robison also posted her excellent notes on the meaning of backchannels and what the game is up to.
While BACKCHATTER (I think) does a good job drawing out what the content of a conference may be about, I'm also interested in the relationships displayed within the tweets. I've discussed some of this before with my breakdown of the first 24-hours of the swine flu story breaking in Twitter. The most interesting stuff I've been looking for has been hubs and authorities. Quoting myself (yeah, yeah):
What is a hub and an authority? Bearing in mind that I'm pretty new at this myself, hubs and authorities are determined by the HITS algorithm. A hub, as I understand it, is a node that links to the highest-scoring authorities--kind of like a really reliable directory of important references. An authority is a node that has been linked to from the highest-scoring hubs--it's been acknowledged, by the most important referrers, to be the most important source of information.
HITS is a bit like the famous PageRank algorithm used by Google. Both wind up identifying the most important things linked to by important other things (I have the PageRank results listed below, too, if you're interested). The cool thing about HITS is that I can get a sense, using my own terms, of who is a reporter and who is a source (n.b.: I'm using "source" in the journalistic sense, not in graph-theory terms.)
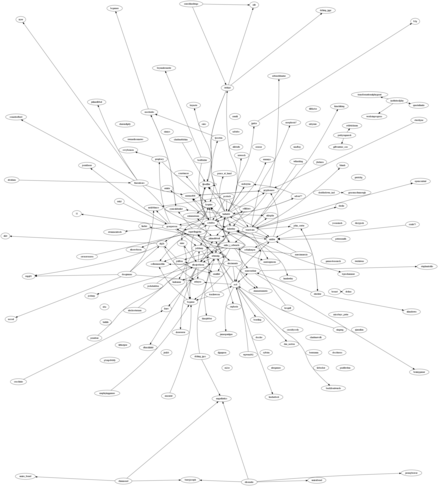
Another interesting way of looking at these relationships is via a sociogram. I use an application called GraphViz (open-source, just like everything else) that takes the nodes (people) and edges (replies/retweets) of the graph (derived from tweets in #gls and #gls09) and draws them out. Here's a smallish version (click on it to get the BIG (1.6 mb) version):
Anyway, the numbers (strongest nodes are at the bottom of the lists--I'm too lazy to reorder them):
Betweenness centrality
tom4cam 0.007
regardingjohn 0.007
alicejrobison 0.010
mkfrie 0.014
gcasperson 0.016
manveerheir 0.016
adamaig 0.017
scd 0.024
hattiebb 0.029
cstubbs 0.032
Closeness centrality in largest SCC
sdikkers 0.375
scd 0.375
manveerheir 0.414
regardingjohn 0.444
audreytan 0.444
advee77 0.462
gcasperson 0.462
mike_j_edwards 0.500
cstubbs 0.571
hattiebb 0.750
Indegree centrality
bcgame 0.036
hattiebb 0.036
scd 0.036
alicejrobison 0.036
ksquire 0.036
cstubbs 0.042
lizlawley 0.042
ljloeffler 0.042
adamaig 0.048
mkfrie 0.048
Outdegree centrality
doogiemac 0.030
adamaig 0.036
regardingjohn 0.048
scd 0.060
gcasperson 0.060
mike_j_edwards 0.060
cstubbs 0.072
alicejrobison 0.072
tom4cam 0.078
hattiebb 0.120
Pagerank
meems808 0.015
lizlawley 0.016
adamaig 0.016
bcgame 0.017
mocheeks 0.017
scd 0.018
mkfrie 0.018
ljloeffler 0.018
colleenmacklin 0.022
gryphoness 0.024
Hubs
mike_j_edwards 0.03
oxala75 0.04
searchhashtags 0.04
tom4cam 0.04
regardingjohn 0.05
cstubbs 0.05
alicejrobison 0.06
scd 0.06
sdikkers 0.07
hattiebb 0.19
Authorities
meems808 0.03
advee77 0.03
mwesch 0.03
eklopfer 0.04
cstubbs 0.04
360kid 0.05
ljloeffler 0.05
mkfrie 0.06
adamaig 0.06
lizlawley 0.08
Metadata
- Total
- 1052
- RT
- 54
- HT
- 0
- OH
- 0
- Mike's blog


- 13422 reads
tags
Copyright Mike Edwards 2006-2009. All content available under the Creative Commons Attribution ShareAlike license, unless otherwise noted.

